Live progress rollups
Project completion computed from approved, weighted sub-projects — never a hand-maintained percentage.
A live operational dashboard that rolls up progress, approvals, budgets, and bottlenecks across every project — computed from the same records your team works in, not a stale weekly export. Drill from a KPI straight into the work behind it.
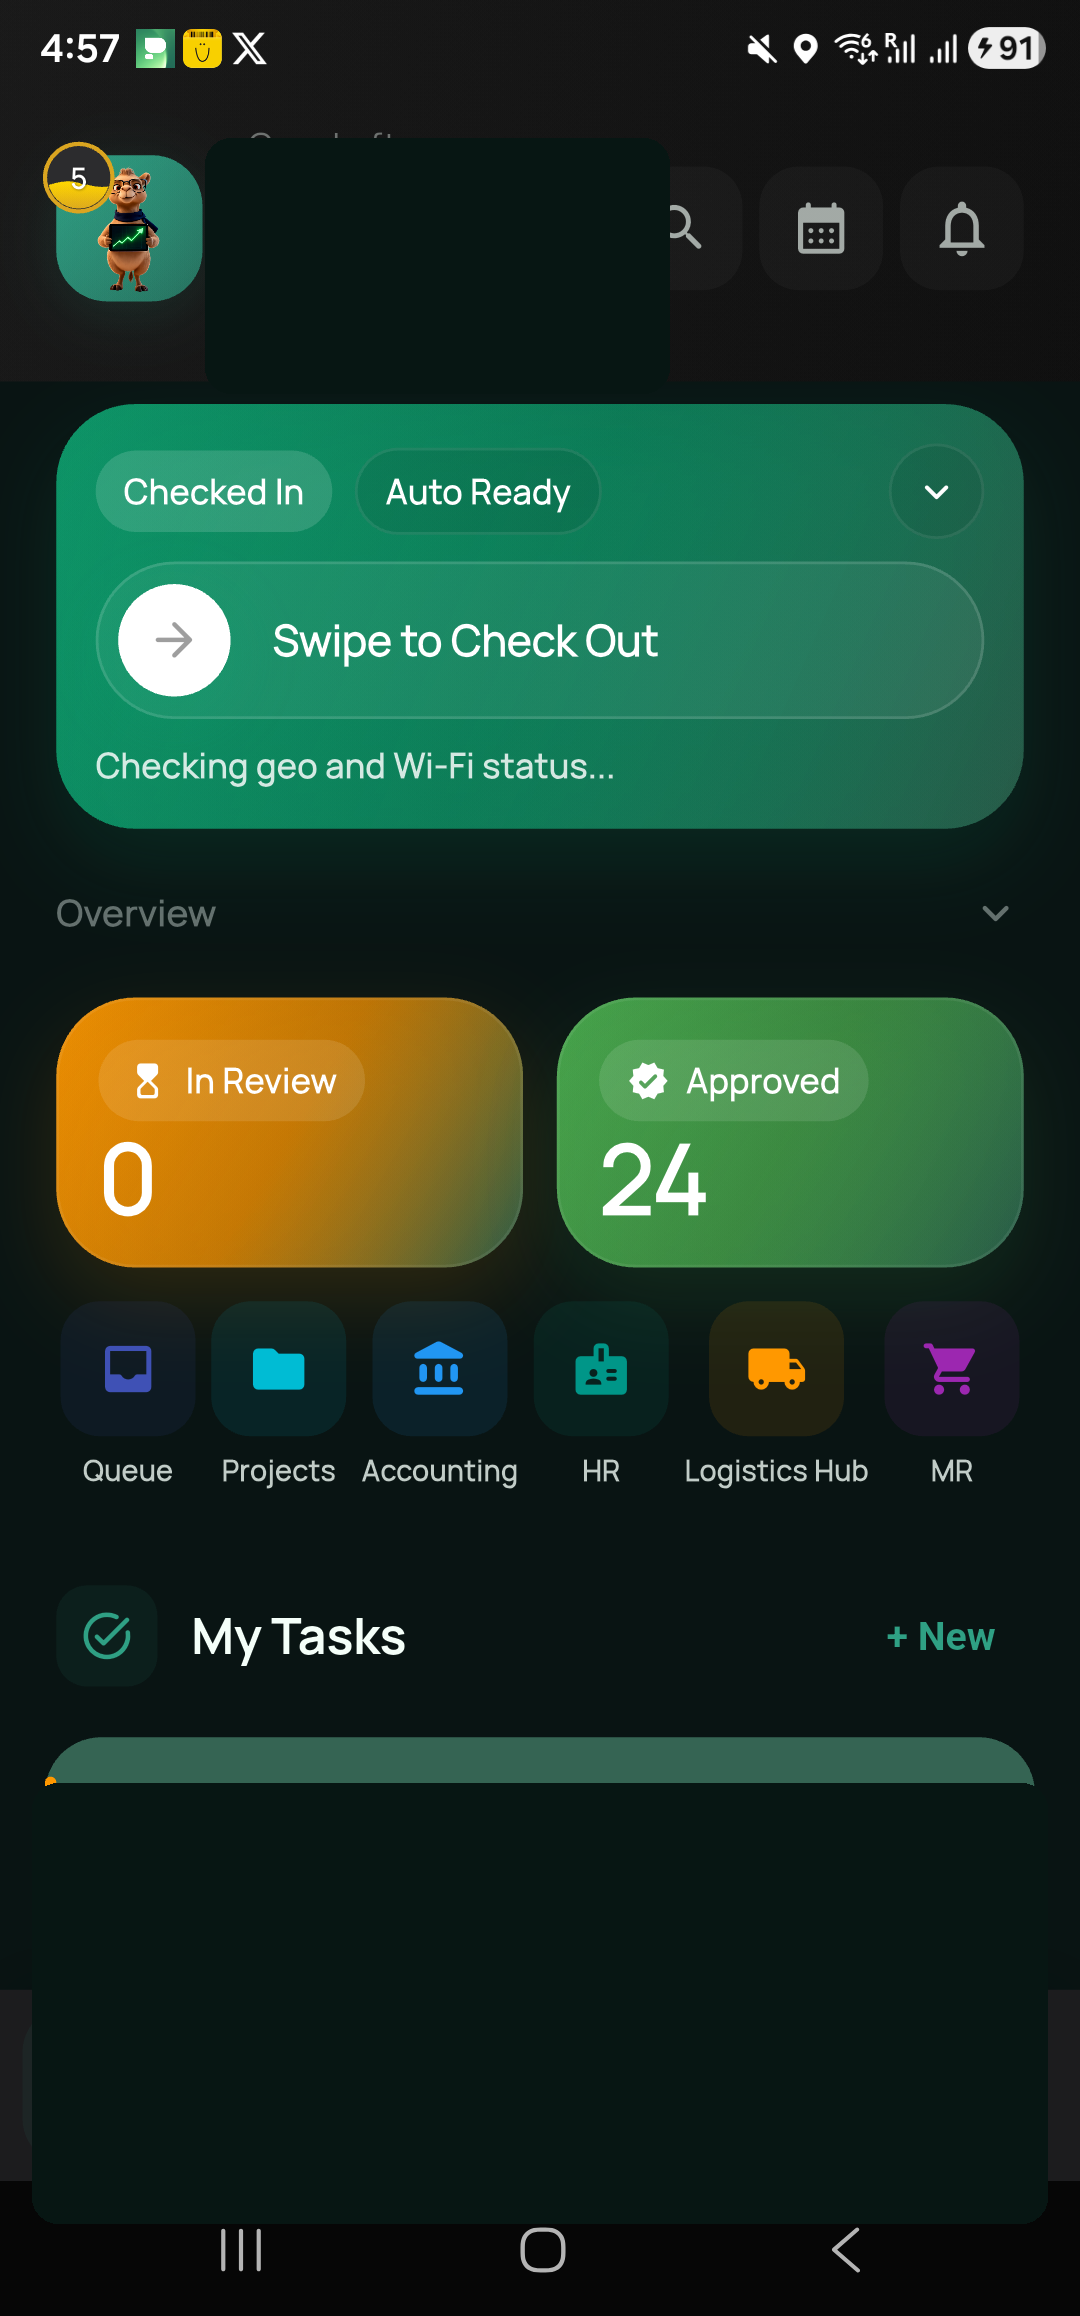
Illustrative interface — a live KPI rollup with drill-down into each project.
What makes it different
Project completion computed from approved, weighted sub-projects — never a hand-maintained percentage.
See exactly where work is stuck: overdue approvals, blocked tasks, and SLA breaches surface automatically.
Track committed and actual spend against budget across the portfolio, updated as transactions land.
Click any KPI to open the underlying projects, approvals, or tasks — no separate BI tool, no data lag.
Leaders see the portfolio; managers see their projects; everyone sees what their role is allowed to.
Push a whole project into review from one place when everything is ready.
| Capability | Spreadsheets & BI bolt-ons | Prime RP |
|---|---|---|
| Real-time, no manual refresh | Manual | Yes |
| Progress from approved work | Typed in | Computed |
| Drill-down to the record | No | Yes |
| Role-based visibility | Separate setup | Inherited |
| Single source of truth | Copies drift | Yes |
FAQ
See your real operating picture update as the work happens.